The economy
In 2022, financial markets were driven predominantly by high inflation and the Federal Reserve’s attempt to slow inflation by raising interest rates. Inflation is a measure of how fast the prices of goods and services are increasing and high inflation especially hurts people on fixed incomes because they can purchase less with their money. After years of very low inflation (near or below the Fed’s 2% target) multiple factors such as the pandemic, global supply chain issues, the Russian invasion of Ukraine, and the many years of “easy” monetary policy to aid in the recovery from the Great Recession combined to make inflation reach high levels (above 6%) and remain elevated for a long time (dispelling the theory this inflation was transitory)1. The Fed has attempted to bring inflation down by raising the overnight lending rate range from 0.00-0.25% to 4.25-4.50% over the course of 20222. As we enter 2023, the economy is beginning to show some signs that inflation has peaked, but the extent and duration of the Fed’s moves in their pursuit to bring inflation back down to their target is the subject of much debate which we expect to be a main driver of financial markets in 2023.

Note: Shaded area represents recession, as determined by the National Bureau of Economic Research.
Source: U.S. Bureau of Labor Statistics
The Stock Market
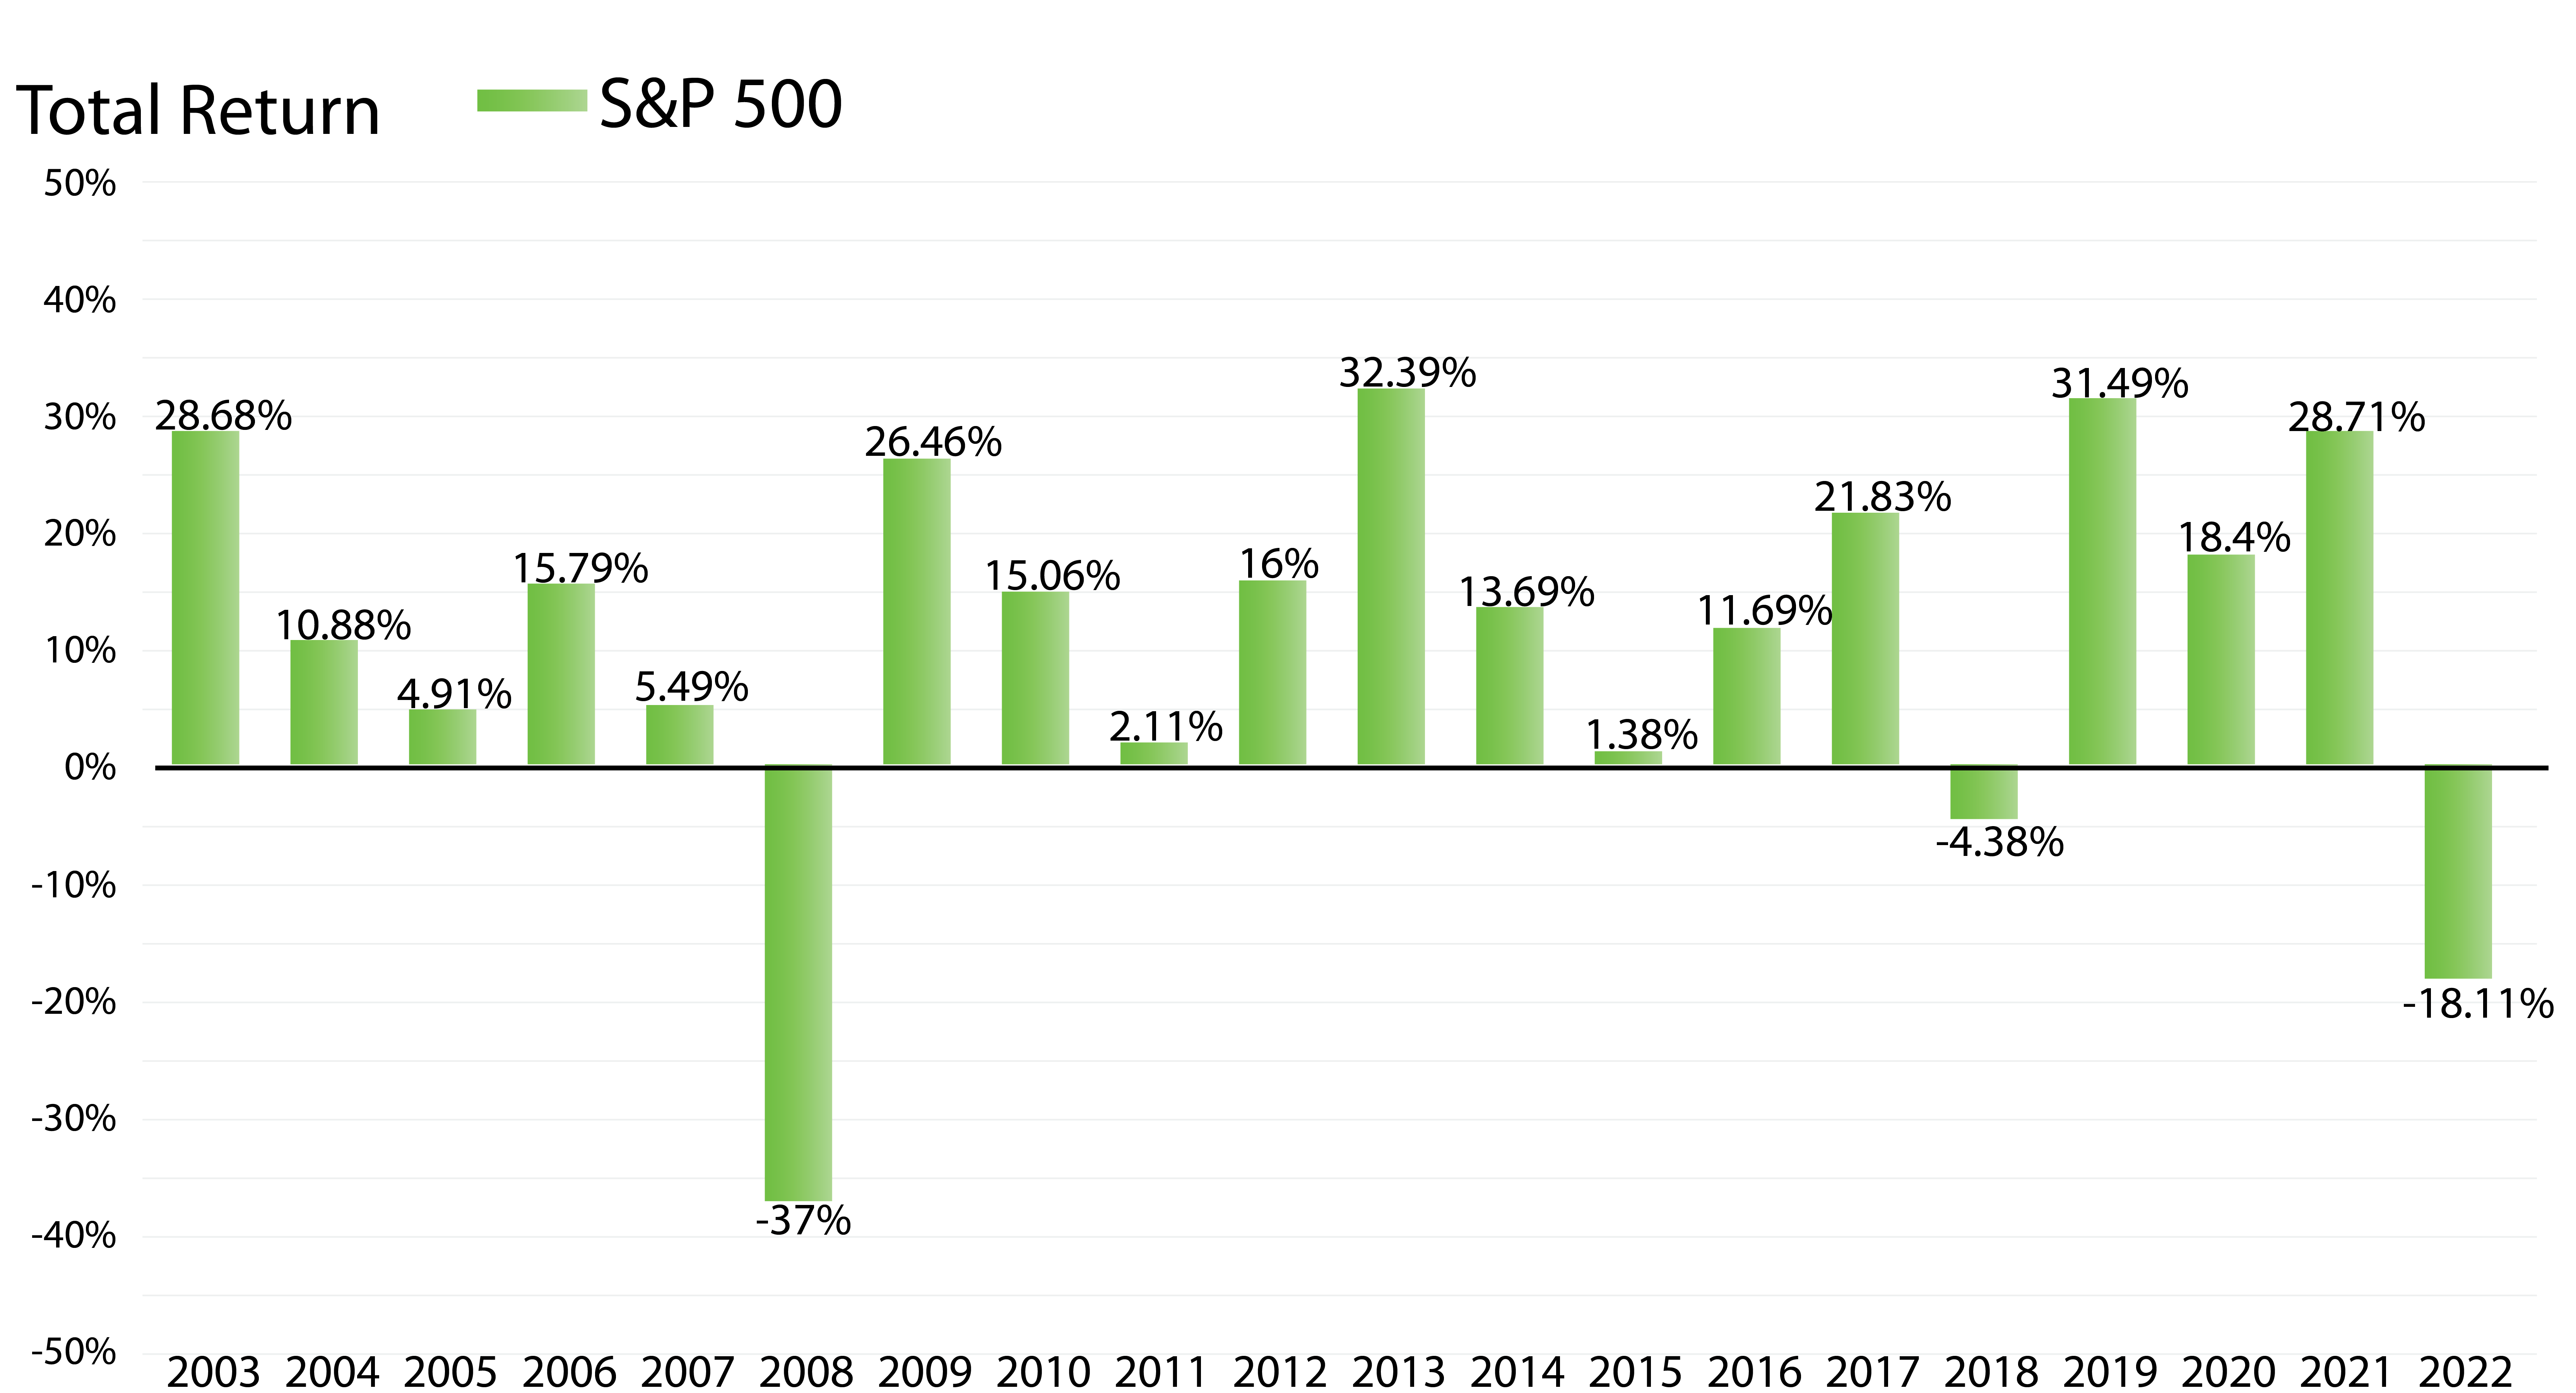
The S&P 500 dropped 18.11% in 2022, which was just the third negative year in the last 20 years3. The situation looked even more bleak for certain areas of the market as the technology, consumer discretionary, and communication services sectors lost 31.55%, 35.52%, and 40.34%, respectively4. It’s an important reminder that the stock market can and does go down from time to time. At times like these, it’s helpful to take a long-term perspective and keep in mind that despite the current bear market and the Great Recession, the S&P 500 has returned an annualized 9.79% over the last 20 years5.
The bond market
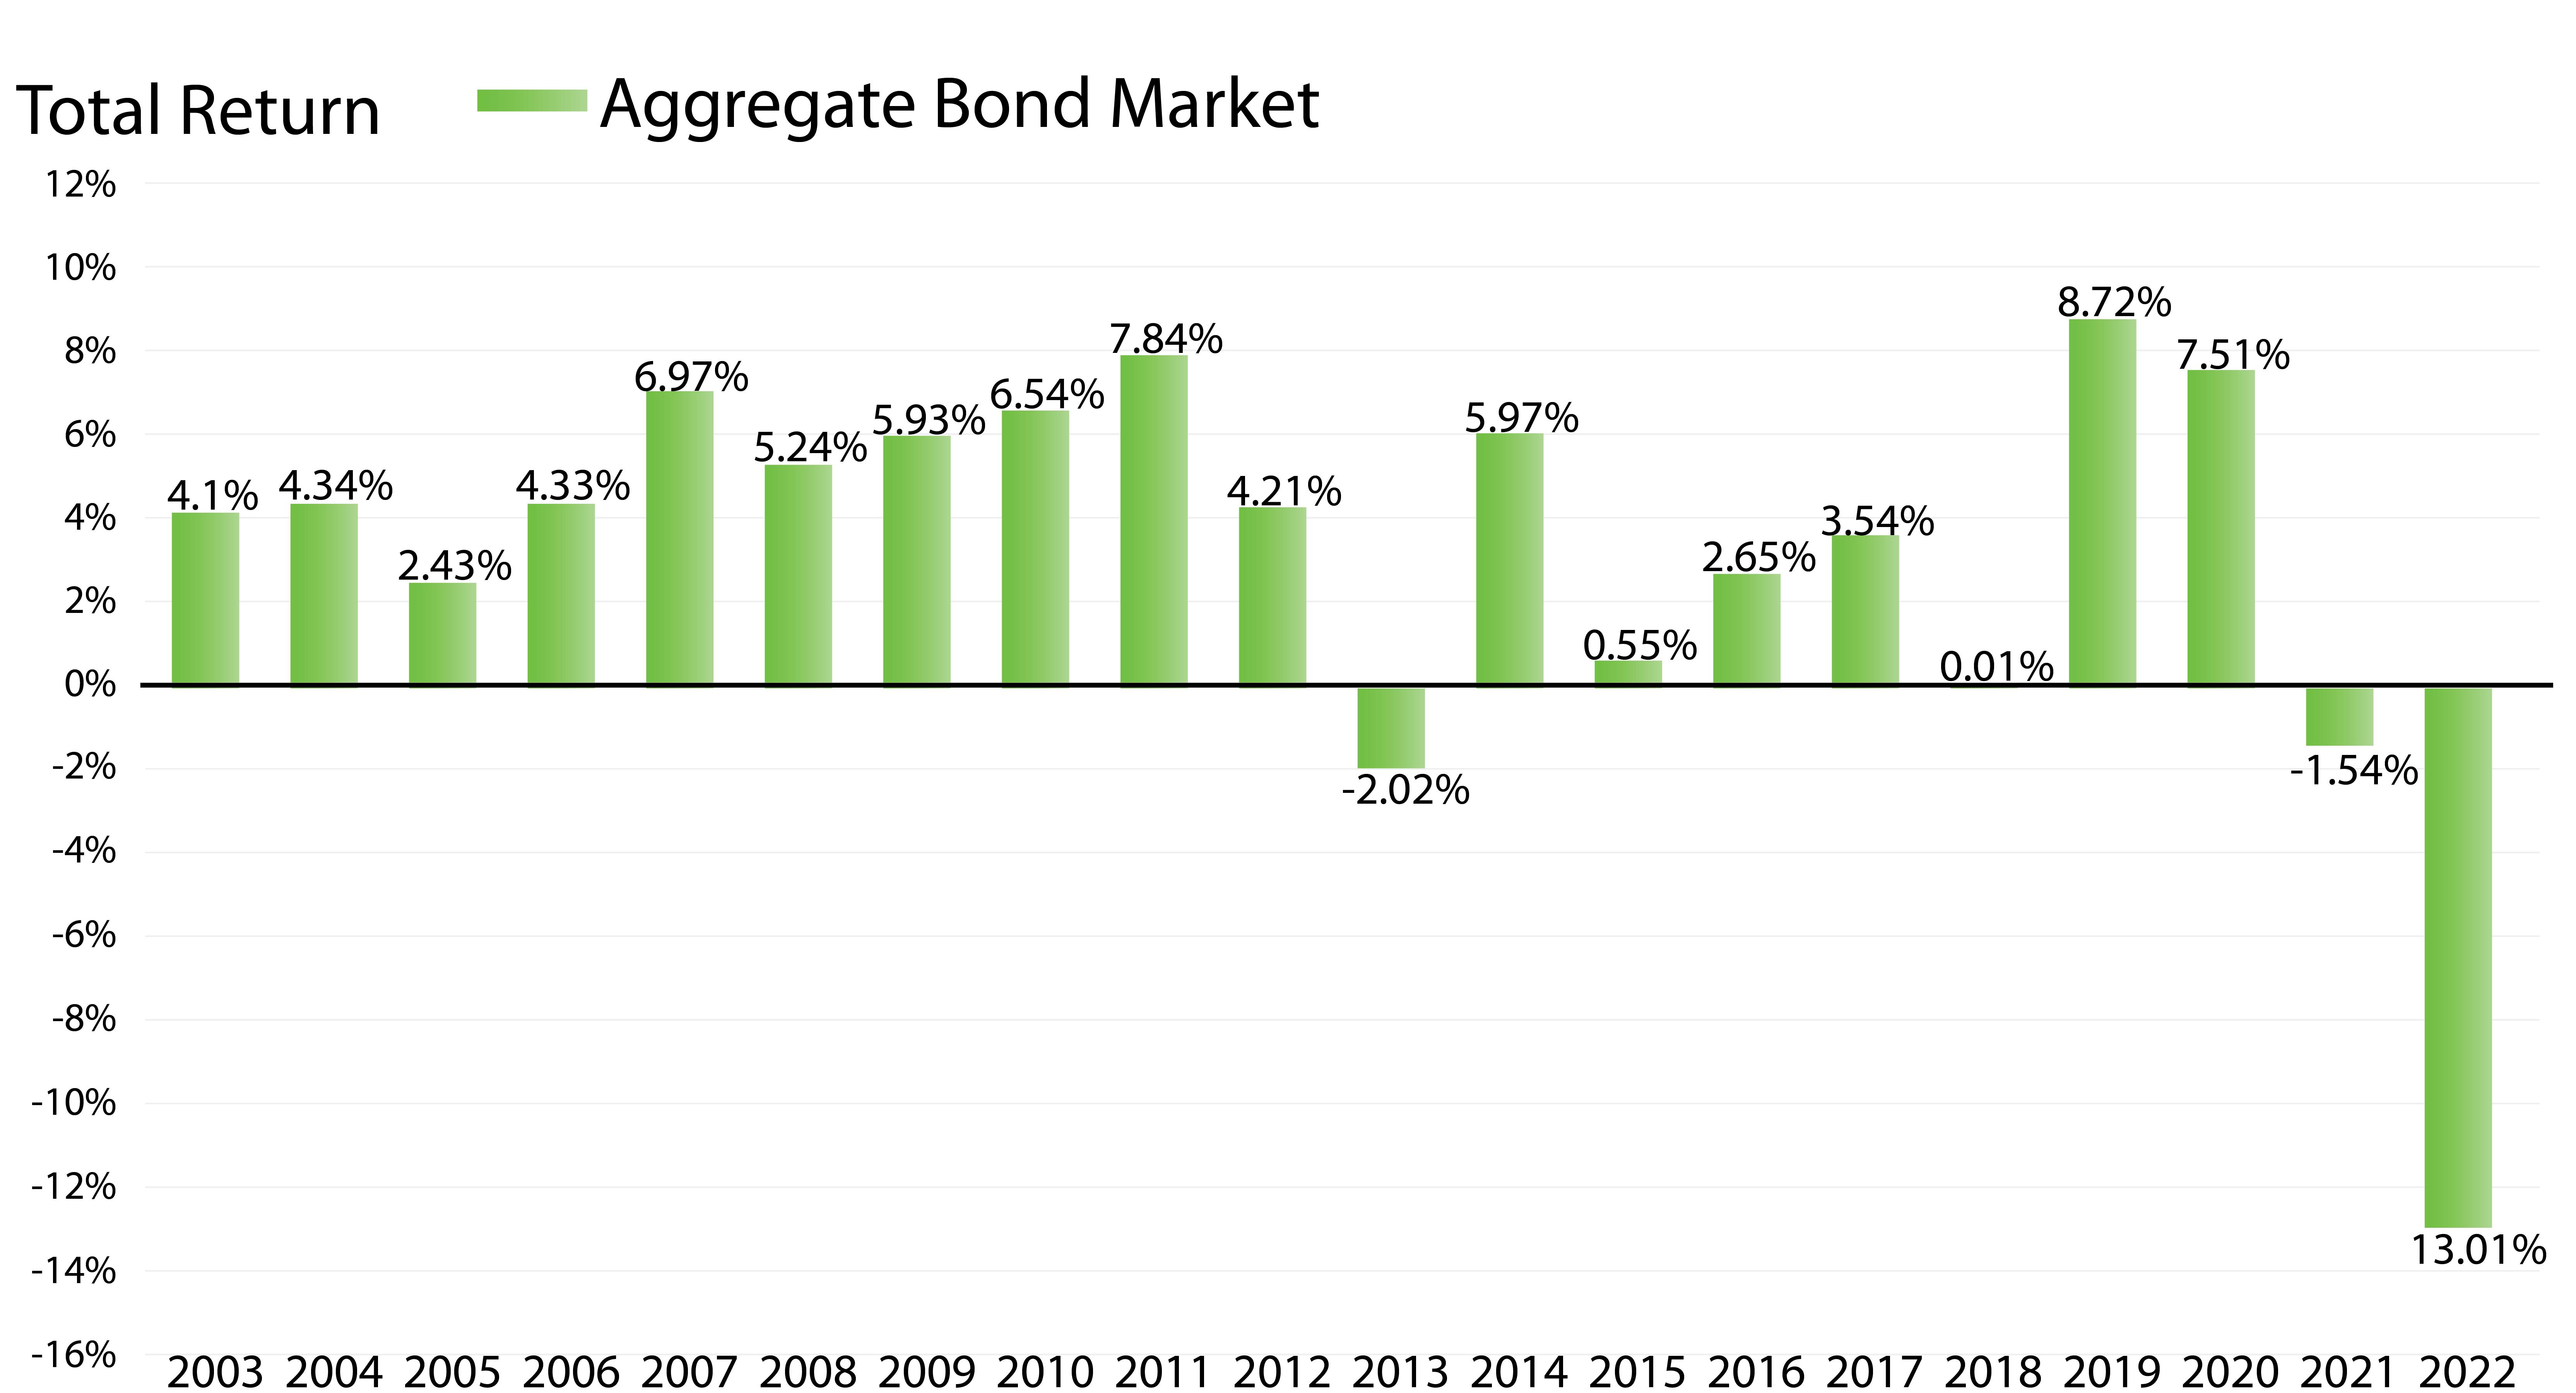
While the stock market gets a lot of attention, it’s the bond market that had a truly bad year by historical standards. Before 2022, the worst return of the US Aggregate Bond index in the last 20 years was -2.02% in 20136. That low was surpassed in spectacular fashion by 2022’s 13.01% loss7. Certainly, conservative-minded investors who invest in bonds for their predictable cash flows and modest volatility are unaccustomed to this level of drawdown. The flip side of such a bad year for bonds is that interest rates are a lot higher moving forward. The 5-year treasury note finished 2022 at 3.99% and investment grade corporate bond yields tend to average 1-2% higher than treasury bonds8. Just as with the stock market, it’s important to maintain a long-term focus as the bond market has returned an annualized 3.10% over the last 20 years despite its significant decline in 2022.
A look ahead…
It’s human nature to react emotionally to bad years for financial markets, even if they are few and far between. Keep in mind that your financial path may be bumpy at times but that’s no reason to take an unwarranted turn. That’s why we take a disciplined approach to managing your portfolio’s risk and make investment decisions for the long term.
Your portfolio should be built with your personal comfort level of risk in mind. During your annual review, we’ll show how your portfolio performed relative to the markets and confirm your appetite for risk. Please call our office if there are big changes in your life or if you’d like to review your portfolio sooner. And as always, we’ll continue acting on investment opportunities as we see them and helping ensure you are on your way to achieving your goals.
Check your inbox for future Market Highlights as we work to keep you informed about various investing topics and demonstrate our investment strategies to protect and grow your wealth.
Regards,
Mike
Michael T. Abram, PhD, CFA
Principal & Portfolio Manager
Sources and Disclosures
1https://www.bls.gov/charts/consumer-price-index/consumer-price-index-by-category-line-chart.htm
2https://fred.stlouisfed.org/series/DFEDTARU
3Data from Kwanti.com based on the S&P 500 Total Return index
4Data from Kwanti.com based on Morningstar US Technology Total Return index, Morningstar US Consumer Cyclical Total Return index, and Morningstar US Communication Services Total Return index
5Data from Kwanti.com based on the S&P 500 Total Return index
6Data from Kwanti.com based on the Barclays US Aggregate Bond index
7Data from Kwanti.com based on the Barclays US Aggregate Bond index
8https://home.treasury.gov/resource-center/data-chart-center/interest-rates/TextView?type=daily_treasury_yield_curve&field_tdr_date_value=2022 and https://fred.stlouisfed.org/series/BAMLC0A4CBBB
Integral Investment Advisors, Inc. dba Integral Wealth Management is a Registered Investment Adviser. This material is for informational and illustrative purposes only and is not intended as an offer or solicitation with respect to the purchase or sale of any security. Advisory services are only offered to clients or prospective clients where Integral Wealth Management and its representatives are properly licensed or exempt from licensure. The views and opinions expressed in this material reflects the personal opinions, viewpoints, and analyses of Integral Wealth Management employees and/or the individual providing such comments, and should not be regarded as a description of advisory services provided by our firm or performance returns of any our firm’s clients. The views and opinions expressed in this material is subject to change at any time without notice. Nothing in this material constitutes investment advice, performance data, or any recommendation that any particular security, portfolio of securities, transaction, or investment strategy is suitable for any specific person. Any mention of a particular security and related performance data is not a recommendation to buy or sell that security. Our firm manages its clients’ accounts using a variety of investment techniques and strategies, which are not necessarily discussed in the material.
This material is developed from sources believed to be providing accurate information; no warranty, expressed or implied is made regarding accuracy, completeness, legality, reliability, or usefulness of any information. Integral Wealth Management may also provide links for your convenience throughout the material to websites produced by other providers of industry-related material. Accessing websites through links directs you away from our content. Our firm is not responsible for errors or omissions in the material on third party websites, and does not necessarily approve of or endorse the information provided. Users who gain access to third party websites may be subject to copyright and other restrictions on use imposed by those providers and assume responsibility and risk from use of those websites.
It is important to note that all investing involves risk including the potential loss of principal. No investment strategy can guarantee a profit or protect against loss in periods of declining values. Past performance is not a guarantee of future results. Our firm urges you to please seek advice from your licensed financial professional prior to making any investment decision.